Standout marketers don’t guess on YouTube—they act on data. From tracking user demographics to analyzing content trends, they leverage actionable insights to build strategies that command attention and drive business impact. Similarly, staying on top of the latest YouTube stats will provide you with insights to fine-tune your strategy and connect with the right audience.
We’ve 28 of the most important social media statistics for YouTube to help you future-proof your strategy. Let’s dive in.
General YouTube statistics
YouTube remains the top destination for online video, offering users worldwide access to billions of videos across multiple categories. The platform sees heavy traffic and engagement daily, making it a prime destination for marketers to reach an engaged audience.
1. YouTube is the #1 online video platform
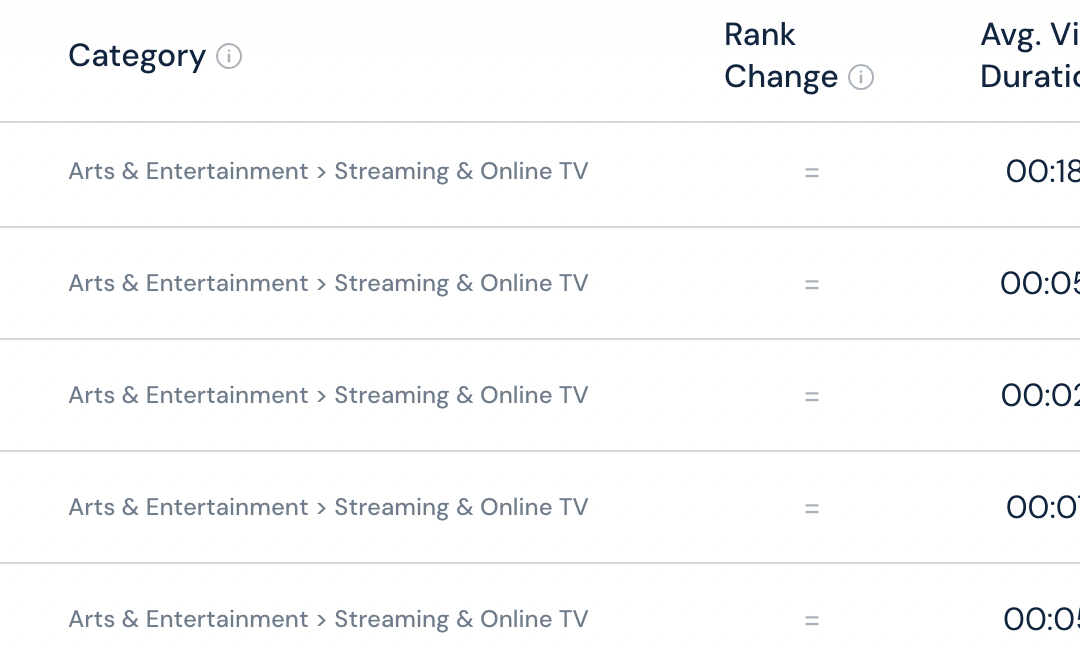
With a growing and active user base, YouTube tops the list among online video sharing platforms. According to the Digital 2026: Global Overview Report from DataReportal, it’s the most used app for video-centric entertainment and TV and movie content.
Similarweb also ranks YouTube as the top website for streaming and online TV, seeing over 28 billion visits in April 2026 alone.
These numbers reaffirm the platform’s position as the top channel for engaging your audience through video content.
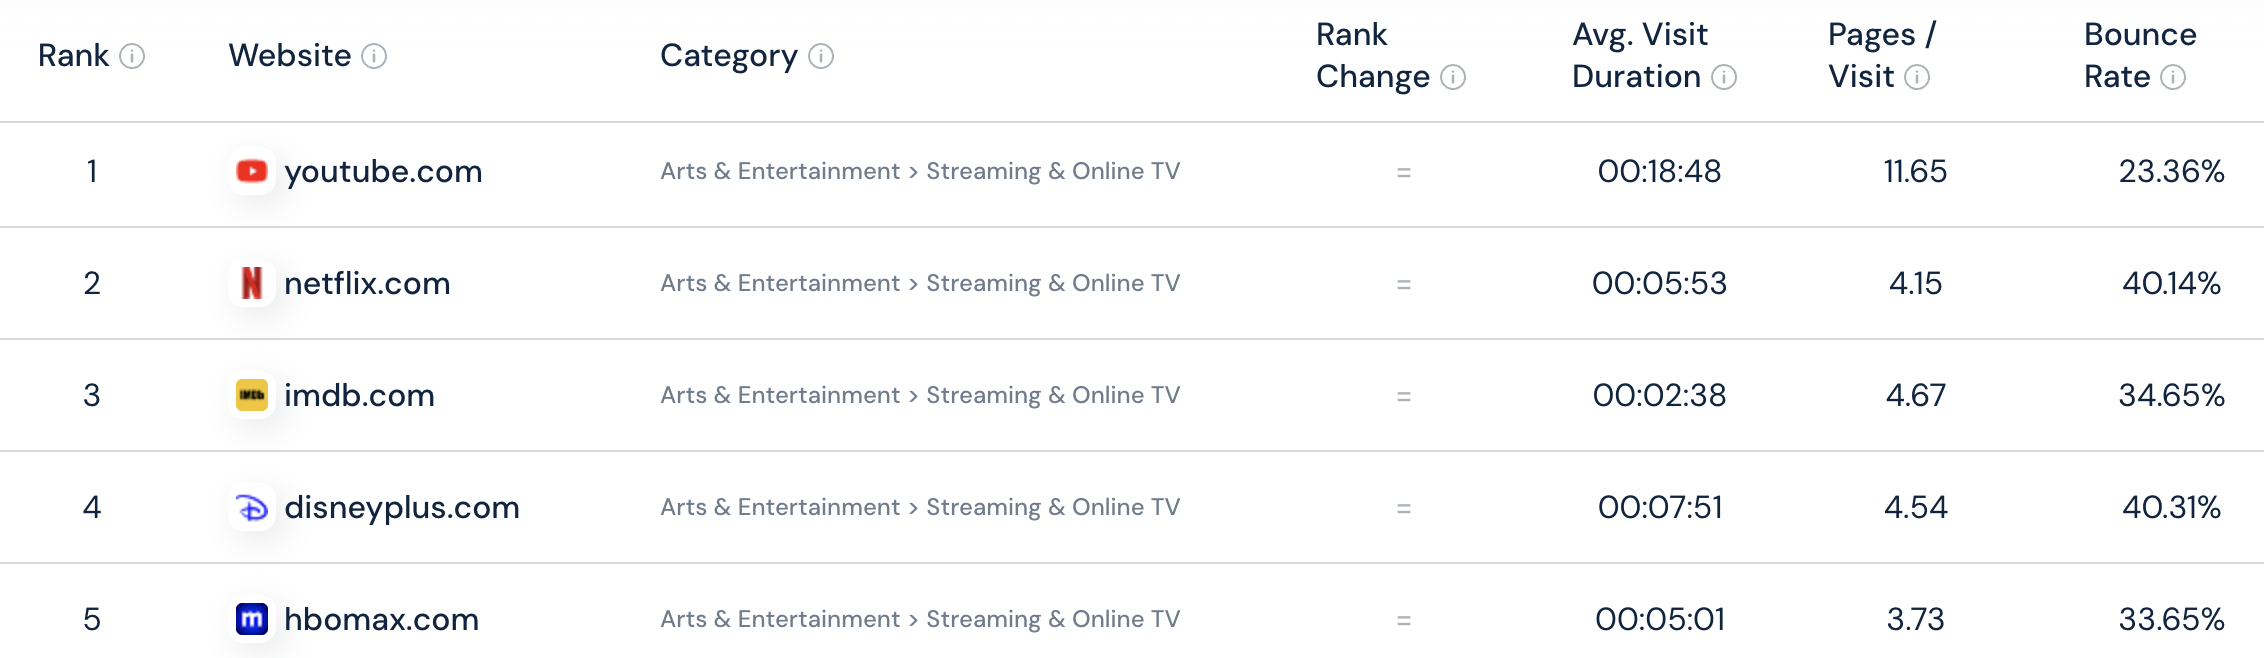
Source: Similarweb
2. YouTube has 2.58 billion monthly active users
According to the Digital 2026 report, YouTube’s potential ad reach totals 2.58 billion users. That’s nearly half of the 5.66 billion social media users worldwide. This cements YouTube’s dominance in the social landscape.
3. YouTube sees the highest total user time
Based on Similarweb App Intelligence data featured in the Digital 2026 report, YouTube claims the greatest share of total social media activity. When looking at the cumulative time spent by Android users globally and indexing YouTube at the baseline (100), the video platform sits far ahead of its closest rivals. WhatsApp and Facebook have index scores of 63.7 and 62.3, respectively.
To put this dominance into perspective, the total time Android users spend on YouTube is nearly double the cumulative time they spend on TikTok, which has an index of 55.1.
With users actively dedicating this much time to the platform, brands have a prime opportunity to capture attention and drive real business impact.
4. Users upload 20 million videos per day
The platform’s users aren’t just watching videos, but also creating content. According to the company’s internal data, YouTube users upload more than 20 million videos each day.
This creates strong competition, making it crucial for marketers to optimize their content with YouTube SEO best practices to stand out.
YouTube audience and user demographic statistics
Looking into YouTube stats on audience and demographics can help you understand who is using the platform. This gives you an idea of whether the platform is ideal for reaching your target audience.
5. YouTube is the second most popular platform among Gen Z
Gen Z grew up with YouTube, and they’re still here. According to the 2025 Sprout Social Index™, 84% of Gen Z-ers have an account, making this platform one of the best ways to reach younger audiences. If your brand is targeting Gen Z, YouTube should be at the core of your content strategy.
6. YouTube users slightly skew male
According to the Digital 2026 report, 53% of YouTube’s advertising audience is male and 47% is female. Because this gender distribution remains balanced compared to other major social networks, YouTube is an ideal platform for brands that want to reach both men and women effectively
(Note: Sprout Social acknowledges gender isn’t binary, but our data sources limit their reporting to male and female.)
7. The largest age group using YouTube is between ages 25 and 34
Users aged between 25 and 34 account for 21.3% of YouTube’s advertising audience, making them the largest age group to use the platform. The second largest age group is between ages 35 and 44, making up around 18.7% of all users.
Brands can use the platform to target older Gen Zs and younger Millennials with high-intent product education videos.
8. India has the largest YouTube audience, followed by the United States and Brazil
There are approximately 518 million active YouTube users in India, making it the network’s largest audience by country. The United States comes next with 259 million users, while 151 million users are from Indonesia.
This solidifies the platform’s global popularity, empowering brands to reach an international audience.
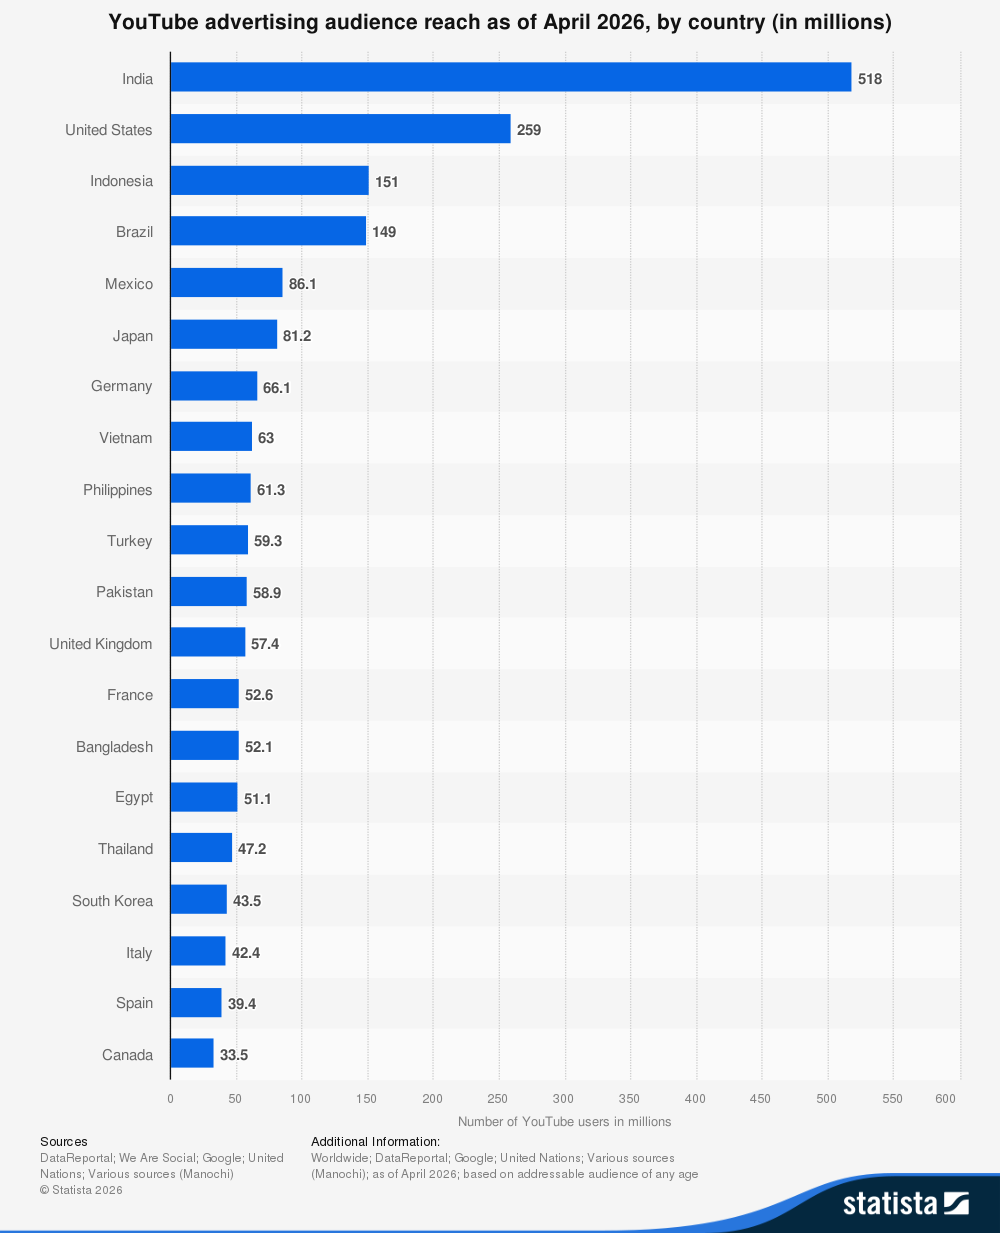
Source: Statista
9. The United States drives the most YouTube traffic
A high user count doesn’t necessarily translate to higher traffic. The US contributes the most YouTube traffic compared to other countries. In April 2026, 21.07% of YouTube traffic came from the United States. In comparison, India, in second position, contributed to just 5.39% of the platform’s traffic.
YouTube usage and engagement statistics
User behavior dictates channel value. Analyzing audience size and session duration reveals exactly why YouTube demands a spot in your social strategy.
10. YouTube is the third most popular social network
The 2025 Sprout Social Index™ reported that over three-quarters (76%) of consumers are on YouTube. This aligns with Statista’s data, which shows that YouTube ranks as the third most popular social network in terms of monthly active users. Facebook continues to hold the top position while WhatsApp and Instagram are tied at #2.
These numbers reaffirm the platform as a top destination for brands looking to connect with a massive audience. Whether you’re running ads, creating educational content or building a community, YouTube offers a solid foundation for brand visibility and engagement.
11. YouTube has the highest average session duration
Users spend almost twice as much time on YouTube as on its next rival, TikTok. The Digital 2026 report shows that the average YouTube session lasts for 14 minutes and 29 seconds. Meanwhile, users spend about 9 minutes per session on TikTok.
YouTube engagement is still going strong, owing to the platform’s continued focus on long-form video and educational content. So the platform is ideal for engaging your target audience with high-quality videos.
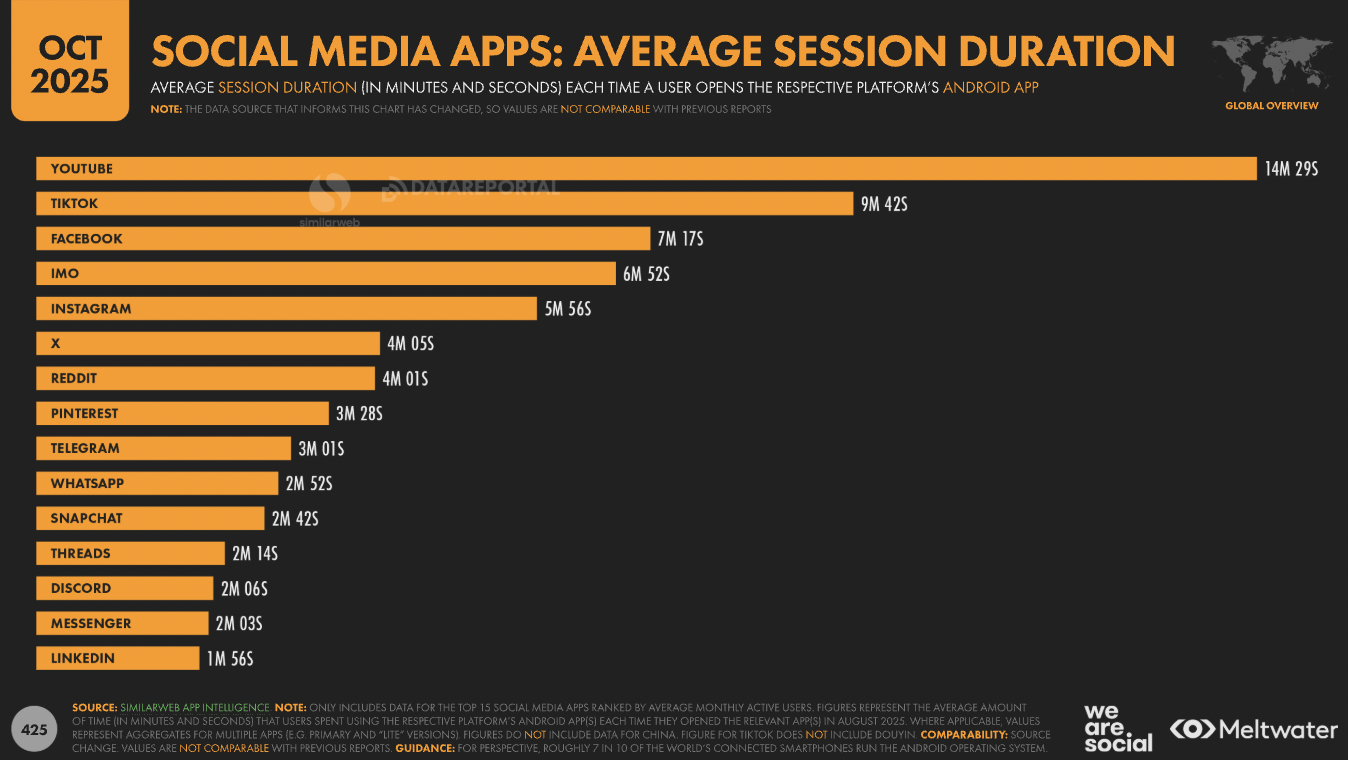
Source: DataReportal
12. Over one-third of consumers use YouTube to keep up with trends
Our 2025 Sprout Social Index™ reports that 37% of users rely on YouTube and TikTok to stay in the loop. However, trends on TikTok can fade fast. YouTube content has a longer shelf life, giving brands more time to make an impact. Tapping into trending topics while keeping content evergreen is a smart way to maximize reach and engagement.
13. YouTube videos receive 3.5 billion Likes per day
YouTube users aren’t just passive viewers. They also interact with the content they watch. In 2024, YouTube videos got an average of over 3.5 billion Likes from users per day. Some users even go beyond Likes and take the time to leave a comment. The same year, users were averaging 100 million comments on a daily basis.
YouTube Shorts statistics
Owing to the growing popularity of short-form video, YouTube launched Shorts in 2020. The vertical video format is accessible on the mobile app and allows users to easily view short videos on their phones.
14. YouTube Shorts has 2 billion monthly active users
The feature is seeing a growing adoption as YouTube users show a stronger preference for short-form video. In 2023, YouTube Shorts reached 2 billion monthly logged-in users.
For brands that are building a presence on the platform, YouTube Shorts offer an opportunity to attract and engage new audiences. Consider creating snippets or teasers to drive users to your longer videos. You could also repurpose short videos from other platforms to gain visibility on YouTube.
15. YouTube Shorts sees an average of 200 billion daily views
YouTube users are watching a lot of Shorts. Internal data reports an average of 200 billion views daily. This highlights just how critical the feature is for brands that want to get their content in front of the platform’s users.
16. Most trending Shorts are 50-60 seconds long
The 2026 Social Media Content Strategy Report found that users prefer videos shorter than 60 seconds. But how short is “short”?
According to a TunePocket analysis, 29.2% of the trending Shorts are between 50 and 60 seconds long. This aligns with another study, which found that longer Shorts performed better on average. And Shorts that see an average view duration of 50 seconds or longer had an average of 4.1 million views.
However, it’s not about the length of the video itself, but about the YouTube algorithm favoring videos that sustain viewer attention.
According to the TunePocket analysis, Shorts that are 10-20 seconds long are the second most popular (27.2%).
Instead of just stretching your Shorts, you should focus more on getting viewers to watch the full video. Use eye-catching visuals and strong hooks to quickly capture attention in the first few seconds.
YouTube video and marketing statistics
You can’t build a winning YouTube marketing strategy in a vacuum. Analyzing how other marketers are using the platform and the types of videos people watch on YouTube is the blueprint for your next campaign.
Let’s look at key YouTube video and marketing stats that are driving the industry forward.
17. YouTube users want brands to be entertaining and informative
People watch branded content on YouTube for entertainment first and product education second, as the 2026 Social Media Content Strategy Report notes. They don’t just want to be sold to; they want to be engaged. Make your content enjoyable and useful. Brands that strike the right balance are the ones that win on YouTube.
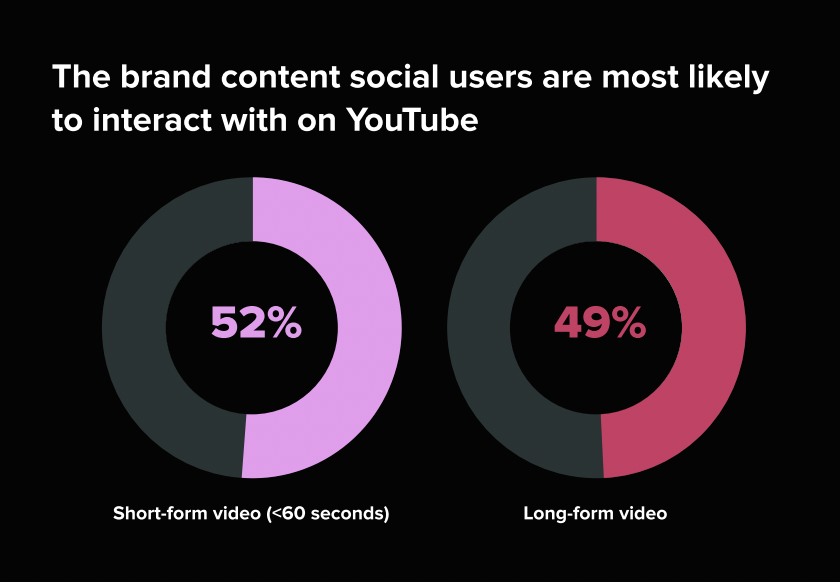
18. Short-form video is on the rise
While long-form video remains YouTube’s foundation, short-form content is actively rewriting the playbook.
According to Sprout Social’s 2026 Social Media Content Strategy Report, consumers are now slightly more likely to interact with short-form video (52%) than long-form (48%), which marks a shift from previous years.
Brands that mix both long-form and short-form content in their YouTube strategy can reach a wider audience while keeping up with changing video trends.
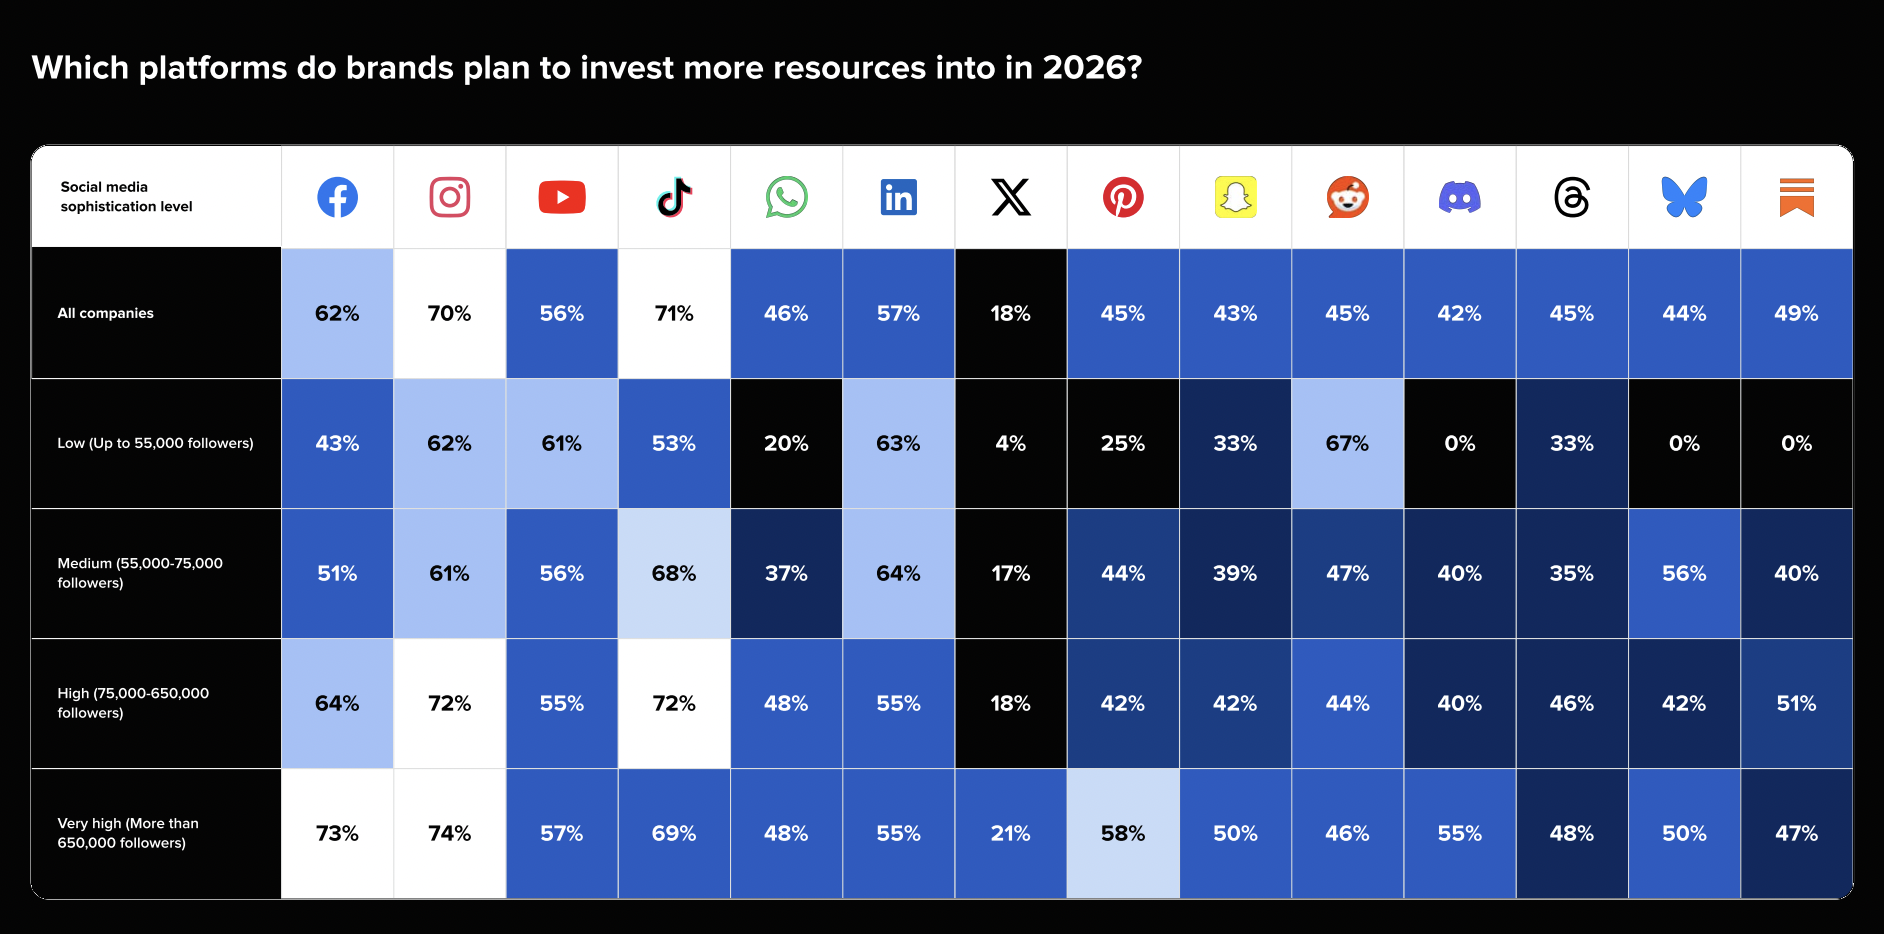
19. 56% of companies are planning to invest more in YouTube
YouTube is becoming a bigger priority for brands of all sizes, with 56% of companies planning to invest more resources into the platform in 2026. This makes it the fifth most important social network where marketers are prioritizing their investment.
Brands need to rethink how YouTube fits into their overall social media strategy if they want to keep up.
20. YouTube’s role in influencer marketing is growing
Over half of US marketers planned to use YouTube for influencer marketing in 2025. YouTube is becoming a top choice for influencer campaigns, thanks to its long-form content and lasting impact. Unlike short-lived social posts, influencer videos on YouTube continue to drive engagement long after they go live.
YouTube advertising and revenue statistics
If you’re planning to run YouTube ads, you need to gauge the platform’s advertising performance. Whether this involves looking into the ad revenue or the best ad formats, it’s essential to study a few vital YouTube advertising stats.
21. YouTube’s ad revenue crossed $40 billion in 2025
YouTube’s annual ad revenue for 2025 amounted to $40.37 billion—up from the previous year’s $36.15 billion. This makes up more than 50% of the platform’s total revenue of over $60 billion.
Ads still bring in a large chunk of the platform’s revenue in spite of the push toward YouTube Premium, which gives users access to an ad-free viewing experience. There’s a good reason for brands to invest in YouTube advertising.
22. YouTube ads deliver the highest recall for Gen Z teens
In fact, YouTube ads are the most impactful for driving awareness, especially among Gen Z consumers. According to a Precise TV study, YouTube was where 67% of Gen Z teens saw ads for the most recent products they asked their parents to buy. This puts it far ahead of its next rival, TikTok (50%) and Facebook (49%).
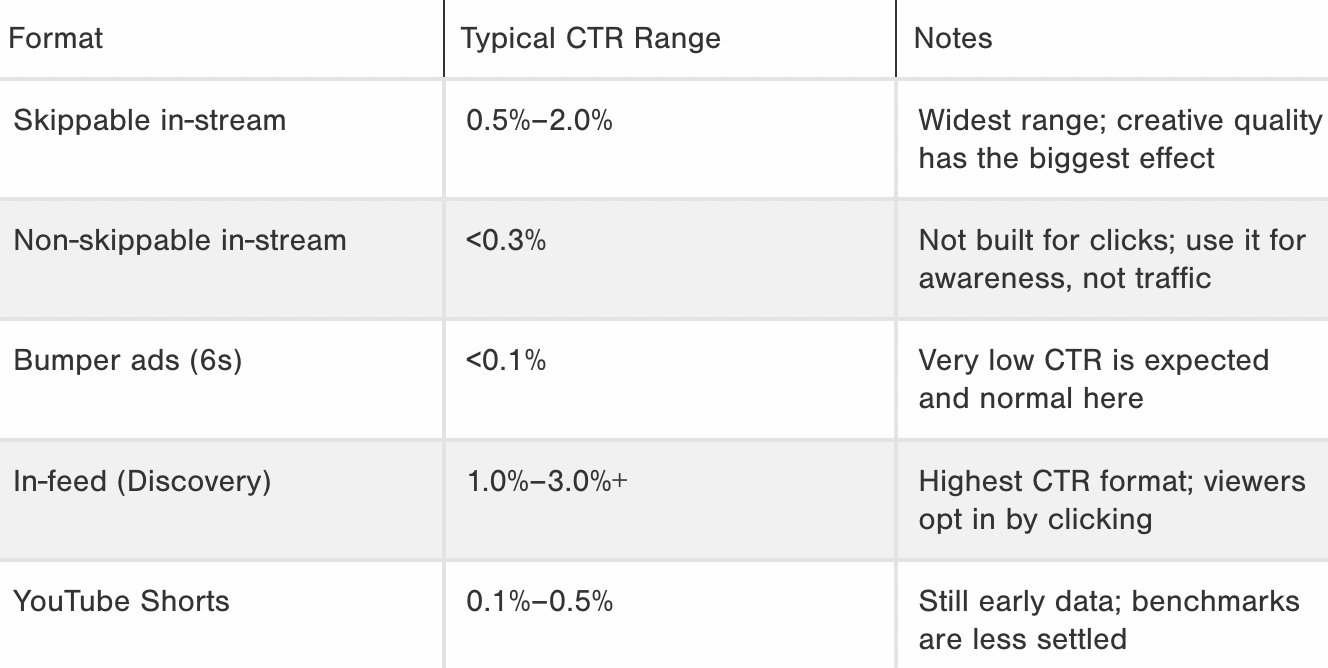
23. In-feed (Discovery) ads see the highest click-through rate (CTR)
Ad placement dictates performance.. In-feed ads see the highest click-through, with CTR ranging from 1.0% to 3.0%. This is far above the platform’s average of 0.65%. Meanwhile, non-skippable in-stream ads hardly get more than 0.3% click-throughs.
So if your goal is to drive clicks, in-feed is your best bet.
Source: Store Growers
24. The average CPM for YouTube ads ranges from $5-$10
For most advertisers, the average cost per thousand impressions (CPM) on YouTube ads ranges between $5 and $10.
Actual numbers vary by format, device and even seasons. In-feed and YouTube Shorts ads see a lower CPM overall at $3–$8 and $4, respectively. And ads served on tablets see a lower relative CPM, while CTV ads cost about $8.72–$10.01.
Additionally, brands tend to see the lowest CPM ($1.98–$2.50) between January and February during the post-holiday lull and between July and August ($1.76–$3.00). The periods between October and December are the most expensive times to advertise on YouTube. CPMs range from $5 to well over $7, as brands gear up for the holiday period.
YouTube consumer behavior statistics
YouTube isn’t just an educational hub—it’s a massive purchase driver. Let’s look at these YouTube stats to understand how the platform drives discovery and purchases.
25. 24% of YouTubers use the network to find new products
According to Sprout Social’s 2026 Social Media Content Strategy Report, 24% of users flock to YouTube for product discovery. This means brands should continue creating in-depth tutorials and deep dives into topics as they still hold value. If your brand has valuable information to share, YouTube gives you the space to do it without cutting corners.
26. YouTube is the #1 platform for product reviews and product information
YouTube’s influence extends far beyond product discovery, with consumers using the platform throughout the research and consideration stages. As educational, long-form videos thrive on the platform, it’s now the top choice for product reviews and information for all consumers across all generations.
This aligns with the previous findings from Sprout, which show consumers preferring a mix of entertainment and education.
27. YouTube Shorts ads are a major driver of Gen Z purchase decisions
YouTube Shorts ads are particularly influential in driving the buying decisions of Gen Z users. According to the Precise TV study, 51% of Gen Z boys and 43% of girls bought something after watching an ad on YouTube Shorts.
Brands wanting to drive purchases, especially those targeting this age group, should promote their offerings through this format.
28. US consumers spend an average of $30 per impulse buy influenced by YouTube
It’s not just Gen Z that’s making purchases influenced by YouTube. In general, US consumers are also making impulse purchases after watching a short video on YouTube. They spend an average of $30 per impulse purchase influenced by short-form content on the platform.
YouTube channel and data statistics
Staying on top of the most popular YouTube channels and categories will let you know what’s working on the platform. These insights can give you creative ideas to promote your YouTube channel.
Let’s look at some key YouTube channel stats.
Most subscribed YouTube channels
- MrBeast (485 million): Balances lifestyle, entertainment and philanthropy
- T-Series (312 million): Focuses on music and entertainment
- Cocomelon – Nursery Rhymes (201 million): Kid-friendly channel focusing on music
- SET India (189 million): Hindi general entertainment channel based in India
- Vlad and Niki (150 million): Children’s entertainment channel
Top YouTube channels by category
Entertainment
- Alan’s Universe (100 million): A channel dedicated to a drama series of the same name. It serves as a blueprint for modern audience engagement and storytelling to guide your content strategy.
- Topper Guild (89.8 million): Focuses on high-engagement, fast-paced content styles that are relevant to Gen Z and Gen Alpha audiences.
Gaming
- Mikecrack (58.3 million): Spanish gaming influencer with a loyal and engaged audience.
- MrBeast Gaming (56.5 million): The gaming-focused channel by MrBeast, where he adds commentary to play-along videos.
Education
- BRIGHT SIDE (44.6 million): A channel dedicated to discussing recent discoveries, space exploration, and more.
- TEDx Talks (44.3 million): A channel showcasing informative and educational videos with an expert speaker from the international TEDx community.
Music
- T-Series (312 million): Offers unmatched reach for brand integration.
- Cocomelon – Nursery Rhymes (201 million): A prime example of modern, data-driven content strategy, serving as a lesson in high-volume content production.
How-to and lifestyle
- MrBeast: Content featuring high-production, philanthropic stunts offers a prime opportunity for brand integration.
- Vlad and Niki: Imaginative, play-based content for targeting families and parents of young children.
Top YouTube channels by country
United States
- MrBeast
- Cocomelon – Nursery Rhymes
- Vlad and Niki
The success of entertainment-focused channels in the United States speaks volumes about the content preferences of US consumers. But considering the global popularity of these channels, it also serves as proof of the US’s command over the content consumption habits of the international community.
United Kingdom
- BBC News – Русская служба (3.01 million)
- Tanveer Evan (3.01 million)
- Elitelupus (2.99 million)
In contrast, the United Kingdom has a much more diverse lineup of regional powerhouses. From news and music to gaming, UK users are consuming a unique mix of content on YouTube.
Canada
- Justin Bieber (78.3 million)
- Sierra & Rhia FAM (51.8 million)
- Super Simple Songs – Kids Songs (46.3 million)
Going over to Canada, entertainment content sees prevalence again. Like in the United States, Canadian users are heavily focused on kids’ entertainment, as is apparent in the channels that dominate from this region.
YouTube metrics marketers should track
Benchmarking your channel and content performance against the latest industry stats will help you understand where you stand. These insights will then show you what works and how to fine-tune your strategy. Here are the top YouTube metrics to keep an eye on:
Watch time and average view duration
Measures the total time users spend watching your video. This reveals your ideal video length, so you can create content that aligns with those viewing habits. In other words, you can create videos that users are likely to watch in full. This will signal to the algorithm that your content sustains user attention, which will boost its visibility.
Subscriber growth rate
Tracks the pace at which a channel gains new followers. You can calculate this metric using the formula:
Monthly Subscriber Growth Rate = (Ending subscribers – Starting subscribers) / Starting subscribers
So if you started with 5,000 subscribers in the beginning of the month and ended with 5,600 subscribers at the end of the month, your growth rate will be:
Monthly Subscriber Growth Rate = (5,600 – 5,000) / 5,000 = 0.12
The average growth rate stands at around 0.03%. So a healthy growth rate should be higher than the average.
Click-through rate
Measures the percentage of impressions that result in clicks. It shows you whether people are clicking on your video to watch it after seeing it in their Feeds or search. So having captivating titles and attractive thumbnails will directly boost your CTR.
Engagement rate
Measures the number of engagements (Likes, comments and shares) relative to views. The algorithm looks at these numbers to assess content quality. Videos that see higher engagements tend to get priority because it signals to the algorithm that people enjoy it, find value in it and even want to share it with their friends.
Audience retention
Measures how long viewers stay on your video. This will help you track patterns in audience retention and identify when drop-offs are most likely to happen. You can then use these insights to inform your content strategy.
Clearly note the difference between:
- Absolute Retention: Percentage of viewers who watched each moment of a video. This paints a clear picture of total user drop-off.
- Relative Retention: Compares performance to a standard, such as a similar video’s average. This shows you whether a specific segment is performing better or worse than expected.
Turn YouTube statistics into a smarter social strategy
Data without action is just trivia. Now that you know exactly who is on YouTube and what they want to see, it’s time to put these insights to work. Use these benchmarks to refine your content, optimize your ad spend, and prove social’s ROI to your executive team.
Download our YouTube Strategy Template for a comprehensive guide on optimizing and growing your presence on the platform.
The post 28 YouTube stats marketers should know in 2026 (Updated) appeared first on Sprout Social.