
Facebook turned 22 this year. And somehow, the platform that everyone keeps writing off still has billions of users and remains the largest social network on the planet.
While the “Facebook is dead” narrative hasn’t aged well, the platform has changed in many ways. How people use it, what content performs and where the money flows all look different than they did even two years ago.
This roundup of social media statistics cuts through the noise and gives you the numbers that actually matter for planning your Facebook strategy in 2026.
Top 3 Facebook stats every marketer should know
Facebook remains a core marketing channel for brands. The statistics below highlight the platform’s scale, performance benchmarks and business impact in 2026.
| Stat / Metric | Insight & Context |
|---|---|
| Facebook has 3.070 billion monthly active users (MAUs) | Facebook remains the largest social platform in the world. This scale gives brands unmatched global reach for awareness campaigns, community building and product discovery. |
| The average engagement rate on Facebook is 0.15% | While engagement rates vary by industry, this benchmark helps marketers evaluate whether their content is performing above or below average. It’s a useful reference point when optimizing posts, ads and organic strategies. |
| 70% of marketing leaders say Facebook delivers positive ROI | Facebook continues to prove its business value. Many marketing leaders report strong returns from the platform, especially when combining organic content with targeted advertising and conversion-focused campaigns. |
Facebook user & usage statistics
Before you plan what to post, you need to understand who’s on the platform and how they use it to inform your Facebook marketing strategy.
These Facebook user and usage statistics cover monthly active users, daily time spent and how people actually engage with content and brands on Facebook in 2026.
1. Facebook hit 3.070 billion monthly active users worldwide in 2025
With over 3 billion MAUs, Facebook remains one of the largest digital platforms in the world. For marketers, this scale makes it uniquely powerful for mass-reach campaigns, international targeting and awareness efforts across multiple demographics and markets.
2. The average user spends 1 hour and 7 minutes on Facebook daily
This level of daily engagement (67 minutes) shows Facebook still commands a large share of users’ attention despite competition from newer platforms. For marketers, this means multiple opportunities throughout the day for content discovery, ad impressions and brand engagement.
3. Around 85% of social media consumers have a Facebook profile
According to Sprout Social’s 2026 Content Strategy Report, more than 8 in 10 social users are registered on Facebook. The platform’s widespread adoption reinforces its position as one of the most universal social networks. For brands, Facebook remains a critical channel for reaching both mainstream audiences and niche communities.
4. According to Sprout Social, nearly 40% of consumers plan to spend more time on Facebook in 2026
This finding from the 2026 Social Media Content Strategy Report of growing audience interest contradicts the narrative that Facebook usage is declining. For marketers, the takeaway is that audiences are still returning to the platform, which makes it worthwhile to continue investment in Facebook content and advertising.
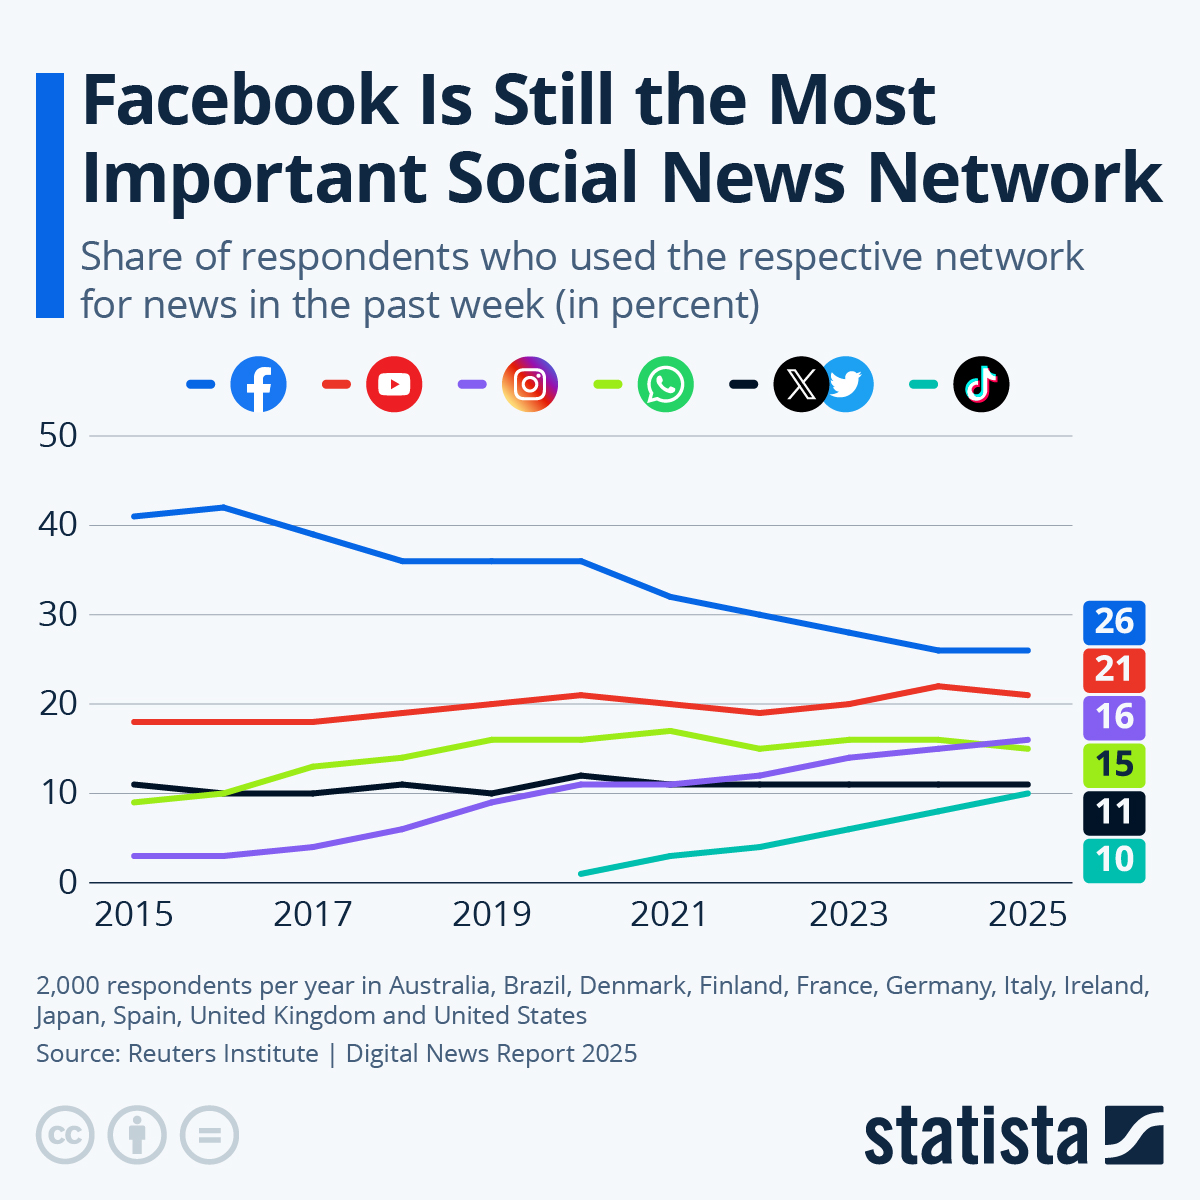
5. Facebook is the most popular social media platform for news
According to a 2025 Reuters report, Facebook is still the leading social news network. Millions of users rely on the platform to discover breaking news, trending stories and commentary from publishers. This makes Facebook a powerful channel for sharing timely content, especially for brands in journalism and public affairs.
6. Facebook is now the #1 platform for product discovery
Sprout’s data shows nearly 40% of social users use Facebook to discover new products. It means people aren’t just stumbling upon products—they’re actively looking for ideas and recommendations here. Marketers should treat Facebook more like a search platform. Use clear captions, helpful content and keywords that make your posts easier to find.
7. Around 35% of Facebook users interact with brand content on the network at least once a day
According to Sprout’s recent Content Strategy Report, users are comfortable interacting with businesses on Facebook. Likes, comments, shares and messages all contribute to ongoing brand conversations. For marketers, Facebook is an ideal place to maintain consistent engagement rather than relying only on occasional campaigns.
8. More than half of consumers say Facebook is their top network for “building community”
Sprout’s data also found that around 52% of users find Facebook Groups and discussions on the platform helpful for connecting with others around shared interests. For marketers, this creates opportunities to build loyal brand communities and engage audiences in deeper conversations.
9. Facebook is the top channel for social customer service
Sprout’s data shows around 45% of users turn to Facebook when they need help from a brand, more than any other social network. For marketers, this means customer support is becoming a core part of the Facebook experience. People expect to ask questions, get answers and even make purchase decisions in the same conversation, often through comments or Messenger.
Facebook audience and demographics statistics
Knowing the size of Facebook’s audience is one thing. Knowing who makes up that audience is what actually shapes your targeting.
These demographic stats break down Facebook’s user base by age, gender, geography and platform overlap to help you understand the full impact of Facebook and build better campaigns.
10. Facebook’s largest audience is aged between 25 to 34
Brands writing off Facebook as a “Boomer platform” are ignoring where a significant portion of its daily activity actually comes from. The 25-34 age bracket makes up the biggest chunk of the platform’s user base, which means it still reaches a core demographic made up of working professionals, young parents and consumers in their prime purchasing years.
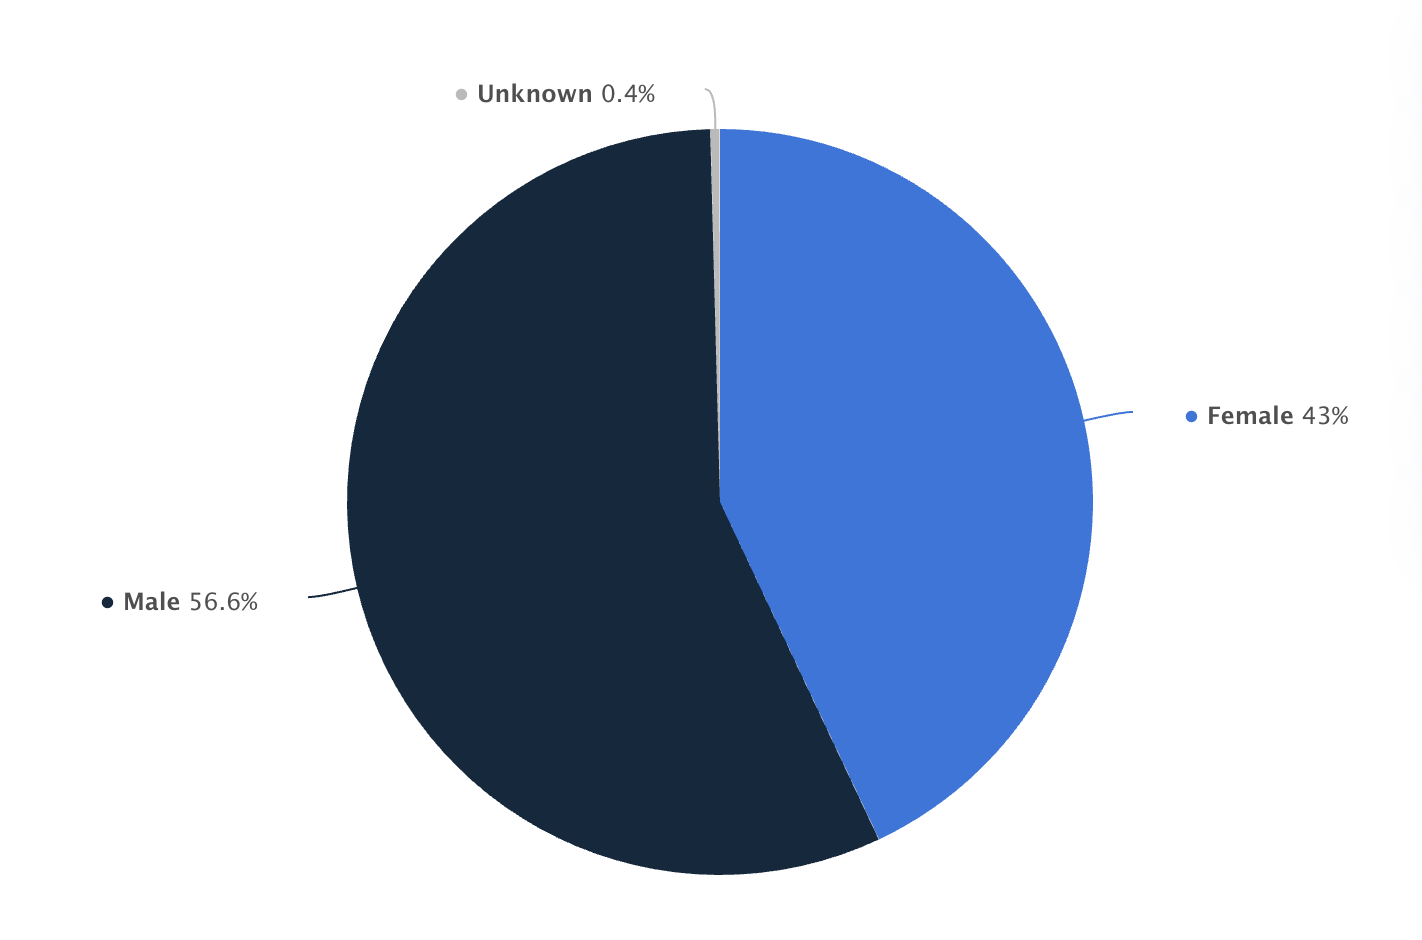
11. Facebook has more male-identifying users than female
Facebook’s global audience shows a small majority of male users (56.6%) vs. female users (43%). However, the difference is not dramatic, which means brands can still reach balanced audiences across both groups. Marketers should focus more on interests and behaviors than gender alone when building targeting strategies.
12. India has the largest Facebook audience size
India leads the world in Facebook users, with the US and Brazil rounding out the top three. For brands running global influencer or ad campaigns, this is a reminder that much of Facebook’s growth comes from emerging markets. Despite massive audience scale, purchasing behavior and spending power can vary widely by region, so geo-targeting matters.
13. Facebook is one of the top social networks used by sports fans
Sports fans are some of the most engaged users on social media, and Facebook (alongside Reddit) ranks among the top platforms they use. For brands in sports, fitness or adjacent industries, Facebook offers a built-in audience that’s actively following teams, leagues and sports content—especially through Groups and Pages.
14. Users aged 65 and above are the most likely to use Facebook
Facebook has become the default social platform for older adults, according to Sprout’s 2026 Social Media Content Strategy Report. Users 65+ are the most likely to choose Facebook relative to their overall internet usage, even though the 25-34 bracket remains the largest audience by volume.
This generational range is part of what makes Facebook unique. Few other platforms let brands reach both younger adults and seniors in the same place.
15. Around 78.6% of Facebook users also use Instagram
With nearly 4 in 5 Facebook users also on Instagram, there’s massive overlap between the two networks, according to the 2026 DataReportal Global Overview Report. Marketers can use cross-platform influencer campaigns to reinforce messaging across both platforms. It also means the audiences aren’t as distinct as people assume.
Facebook advertising and marketing statistics
Is Facebook marketing still worth it? And are you getting the most out of your Facebook advertising strategy? Check out these Facebook ads statistics to understand the impact of advertising and marketing on the platform.
16. According to Sprout Social, 62% of marketers plan to invest more time and resources into Facebook in 2026
Despite the narrative that Facebook is losing relevance, the majority of marketers are actually planning to increase their investment in the platform. This signals that the retention and engagement data marketers are seeing internally is strong enough to justify doubling down, even as industry chatter favors TikTok and Instagram.
17. Seventy percent of marketing leaders agree Facebook has the strongest impact on their business compared to any other platform
Sprout’s data shows as many as 7 in 10 marketing leaders say Facebook drives more business impact than any other social platform. The data suggests Facebook’s value shows up more clearly in revenue and pipeline metrics than in vanity engagement numbers.
18. Facebook ads see an average click-through rate (CTR) of 2.59%
Facebook’s average CTR for leads campaigns sits at 2.59% across all industries. For traffic campaigns specifically, the average is 1.71%—up from 1.57% the year prior. Both numbers indicate that Facebook ads continue to improve in performance, even in a more competitive environment.
19. The average cost-per-click (CPC) for Facebook traffic campaigns is about $0.70
Facebook traffic campaigns average just $0.70 per click, making it one of the more affordable paid channels for driving website visits. Leads campaigns run higher at $1.92 CPC (up slightly from $1.88 the prior year), but both figures remain competitive compared to Google Ads and LinkedIn.
20. The average conversion rate on Facebook is 7.72% across industries
Facebook leads campaigns convert at an average of 7.72% across all industries—slightly down from 8.67% the year before. Even with that dip, a nearly 8% conversion rate is strong by any paid media standard and explains why so many marketers still allocate budget to the platform.
Facebook engagement statistics
Engagement on Facebook looks very different than it does on TikTok or Instagram. These benchmarks show you what realistic engagement looks like on the platform, which content formats drive the most interaction and why account size matters more than you might think.
21. The average engagement rate on Facebook is 0.15%
Facebook’s average engagement rate per post is just 0.15%, the lowest among major social platforms. This number hasn’t budged year-over-year. Brands relying purely on organic posting without paid amplification or community engagement are not likely to see meaningful results.
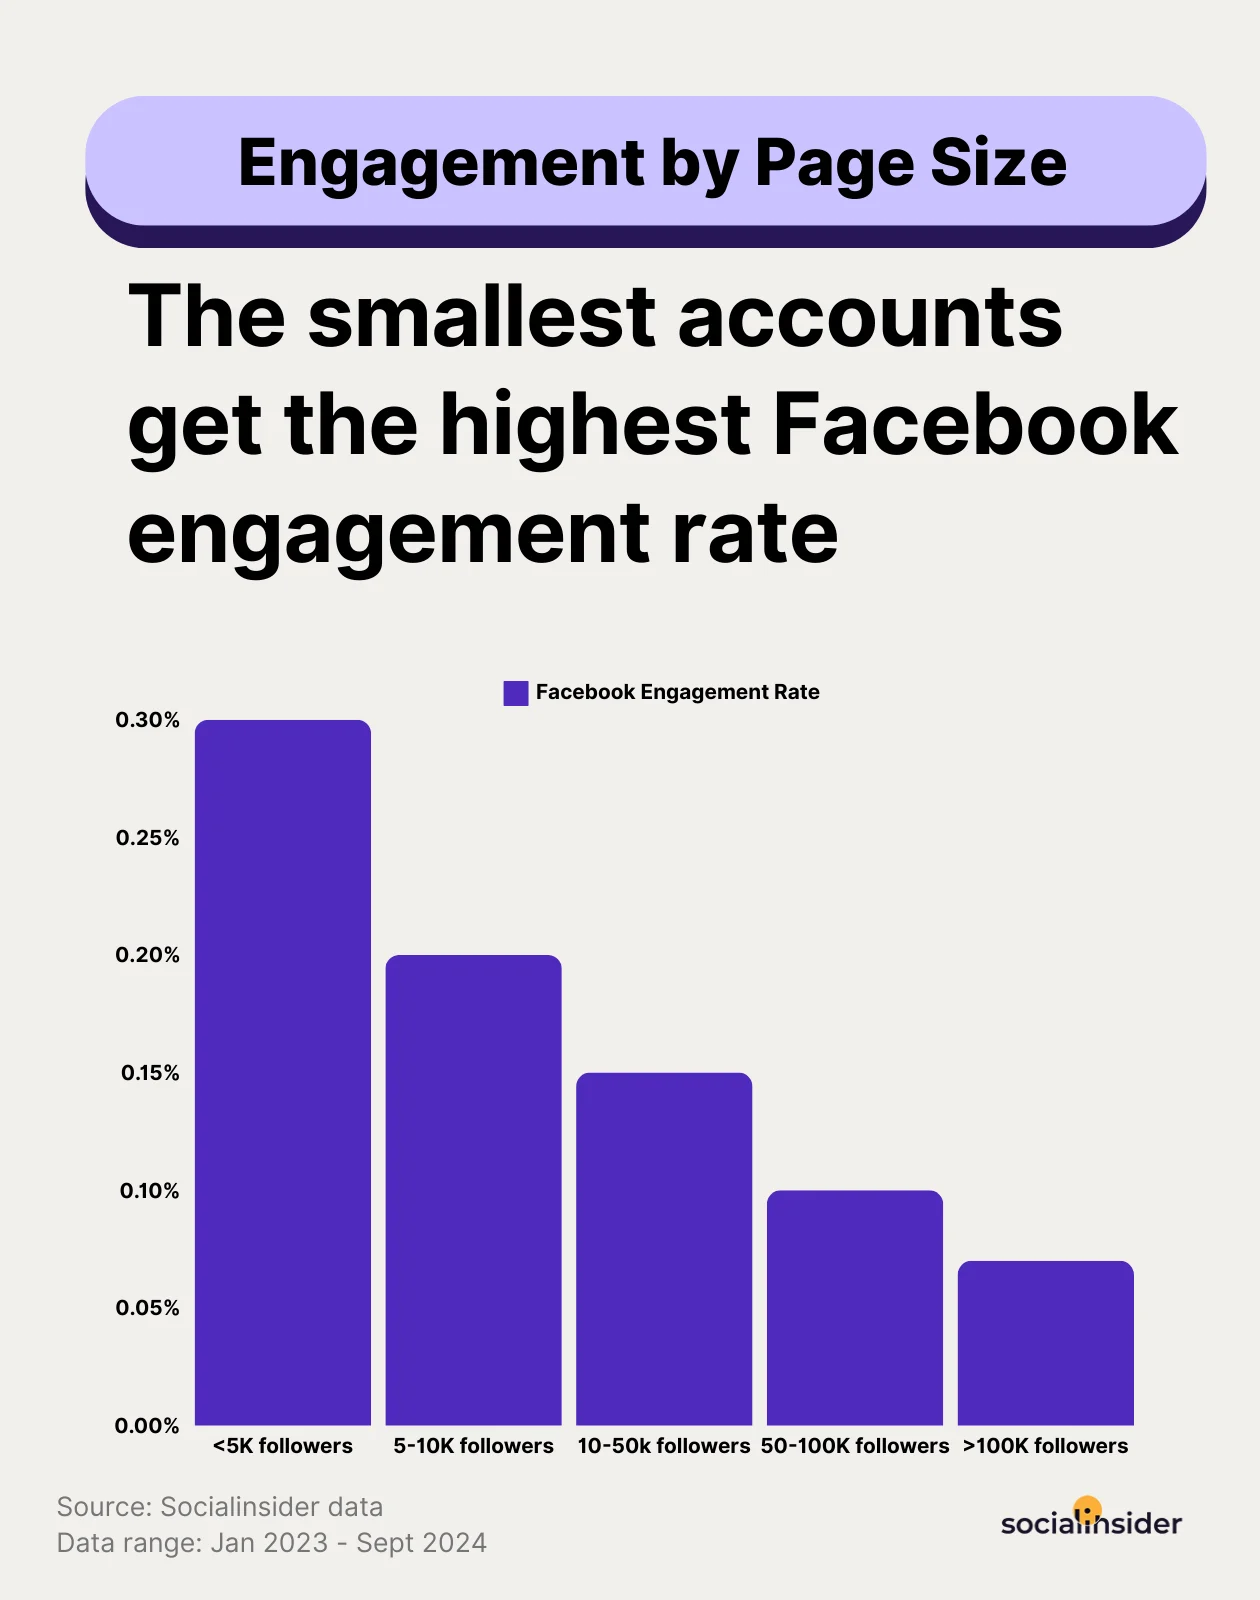
22. The smallest accounts get the highest Facebook engagement rates
Facebook accounts with fewer followers consistently outperform larger ones in engagement rate. This follows the classic micro-influencer pattern: smaller, more niche audiences tend to interact more actively with content. For influencer campaigns, this suggests that partnering with smaller Facebook creators may deliver better engagement per dollar.
23. Albums and photo posts have the highest engagement
Despite the platform’s push toward video, albums and photo posts still drive the highest engagement on Facebook. This is worth noting for content strategies: not every post needs to be a Reel. Static visual content, especially curated image collections, still resonates with Facebook’s user base.
Facebook video statistics
As video marketing continues to gain popularity, it’s important to be aware of how video performs on Facebook. Here are some key Facebook video statistics to inform your strategy:
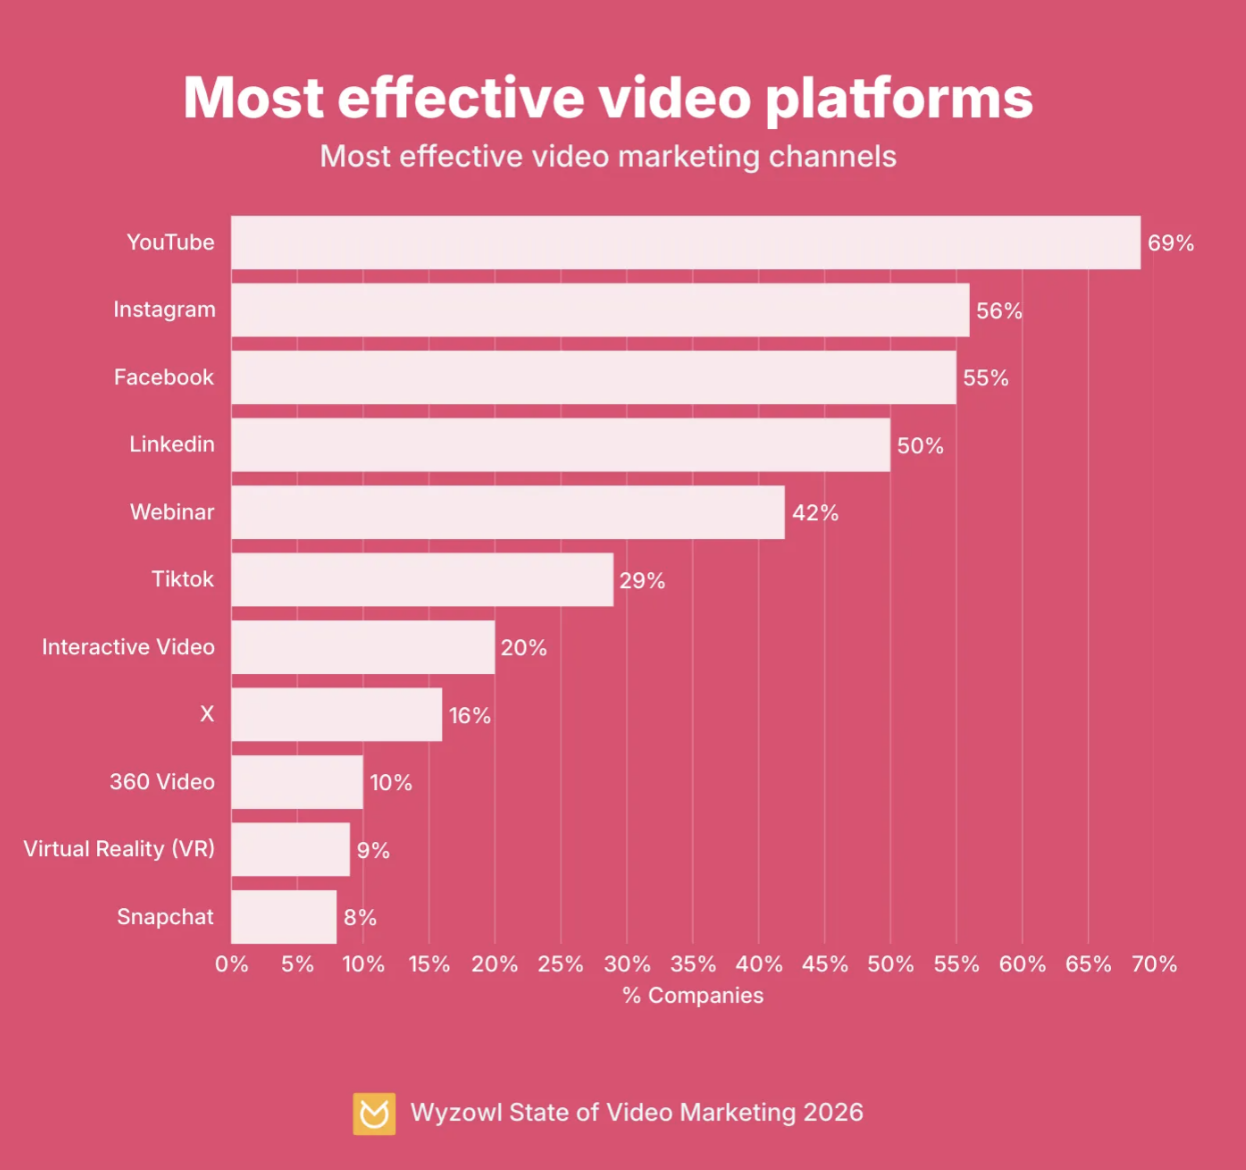
24. Facebook is one of the top three most effective video marketing platforms
Around 55% of marketers rank Facebook as a top platform for video marketing effectiveness, placing it just behind YouTube (69%) and Instagram (56%). It’s also the fourth-most popular platform for video marketing overall, used by 66% of video marketers. The combination of Reels, Live and in-feed video on Facebook gives brands multiple formats to work with depending on their goals.
25. Engagement on Facebook Live peaks between 30 and 40 minutes
Facebook Live streams hit their engagement sweet spot around the 30-40 minute mark. Going shorter doesn’t give the algorithm enough time to push the stream to more viewers, and going longer leads to drop-off. For brands planning live sessions, this is the window to aim for.
Facebook Reels statistics
Reels are Facebook’s fastest-growing content format and a priority for Meta’s algorithm. These numbers show what length performs best, which content types users prefer and how Meta’s own creator tools are reshaping how Facebook and Instagram Reels get made.
26. Users are most likely to interact with short-form videos on Facebook
According to Sprout’s Social Media Content Strategy Report, nearly half (48%) of Facebook users say short-form video is the content type they interact with most, followed by text posts (32%) and live video (22%). This confirms that Reels and short clips are now the dominant engagement format on Facebook—a shift that aligns with Meta’s broader algorithmic push toward video.
27. Facebook Reels between 90 to 120 seconds get the most engagement
The engagement sweet spot for Facebook Reels is 90 to 120 seconds. That’s notably longer than the typical TikTok or Instagram Reel, which suggests Facebook’s audience is more willing to sit with slightly longer short-form content. Creators and brands should optimize for this window rather than defaulting to 15-30 second clips.
28. Nearly 10% of the Reels people view each day are created in Meta’s Edits app
Meta’s Edits app (its CapCut competitor) is gaining traction. In their Q4 2025 earnings call, Meta revealed that nearly 1 in 10 daily Reels views now come from content made in Edits, a figure that almost tripled in a single quarter. This shows the platform is successfully pulling creators into its own content creation ecosystem, reducing reliance on third-party editing tools.
Facebook Stories statistics
Stories don’t get as much buzz as Reels, but millions of daily users are hard to ignore. These stats show how people engage with brand Stories on Facebook, from product discovery to website visits, and why the format still deserves a spot in your content mix.
29. More than 500 million people still use Stories every day
Facebook Stories hit 500 million daily users, a number that’s easy to overlook given how much attention goes to Reels. For brands, Stories offer a more intimate, ephemeral format that’s ideal for flash promotions, behind-the-scenes content and direct calls to action—with a massive daily audience to back it up.
30. 50% of Facebook users that watch brand Stories want to be introduced to new products
Half of the people watching brand Stories on Facebook are actively looking to discover new products. That’s a remarkably high purchase intent signal for an organic content format. Brands that treat Stories as a product discovery channel (not just a brand awareness tool) are better aligned with what their audience actually wants.
31. After watching a Story, 58% of people have visited the brand’s website to get more information
Nearly 6 in 10 users say they’ve visited a brand’s website after seeing a Story. This downstream action makes Stories one of the stronger top-of-funnel formats on Facebook for driving traffic, especially when paired with swipe-up links or compelling CTAs.
Facebook Messenger statistics
Messenger is Facebook’s one-to-one communication layer. It’s also a channel most brands underutilize. These Facebook Messenger stats cover audience demographics, daily usage time and what the data means for conversational marketing and customer support.
32. Messenger is used by more than a billion people each month
According to Meta, Facebook Messenger was home to over a billion monthly active users in Q1 2025, making it one of the largest messaging platforms in the world. For brands, that scale opens up opportunities in conversational marketing, customer support automation and direct-response campaigns that meet users where they’re already chatting.
33. Females aged 65+ are most likely to use Facebook Messenger
The heaviest Messenger users are older women over the age of 65, according to DataReportal. This is a potentially useful data point for brands in healthcare, insurance, senior living or any category targeting older female consumers.
34. Users spend an average of 19 minutes daily using Messenger
The average Messenger user spends 19 minutes a day in the app, again according to DataReportal. That’s a decent chunk of daily attention, and it represents time spent in a private, high-intent context—not passively scrolling a feed. Brands leveraging Messenger for direct outreach, automated sequences or customer support are tapping into focused attention time.
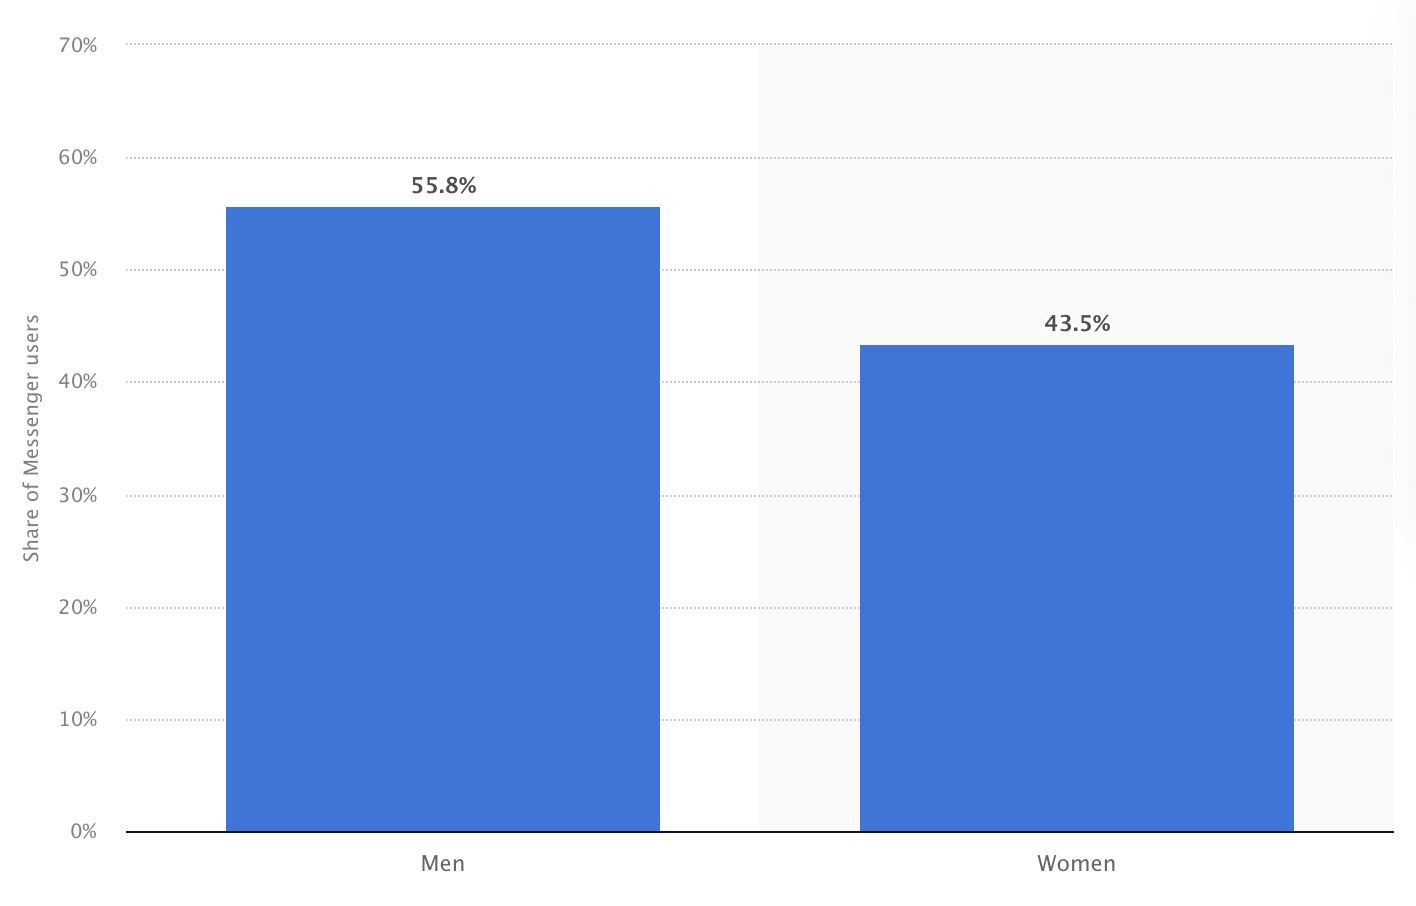
35. Nearly 56% of Facebook Messenger users identify as male
Messenger’s user base skews slightly male at 55.8%, similar to Facebook’s global audience. For brands running Messenger-based campaigns (e.g., chatbots, direct outreach or lead generation flows) this gender split is worth factoring into targeting and creative decisions.
Facebook influencer statistics
Influencer marketing on Facebook doesn’t get the same attention as Instagram or TikTok, but the data tells a more interesting story.
These stats cover which demographics engage with influencers on Facebook and how marketers and creators are shifting their platform priorities.
36. About 50% of Baby Boomers are most likely to engage with influencers on Facebook
Facebook is where older audiences actually pay attention to influencer content. Sprout Social’s State of Influencer Marketing Report shows half of Baby Boomers say Facebook is the platform where they’re most likely to engage with influencers—a number that dwarfs any other platform for that demographic.
If your brand targets 55+ consumers, running influencer campaigns on Instagram or TikTok alone means you’re probably missing your highest-intent audience entirely.
37. Both marketers and creators plan to use Facebook less for influencer marketing in 2026
There’s a growing disconnect between Facebook’s audience potential and where marketers are actually headed. Around 28% of marketers plan to use Facebook the least for influencer marketing this year, compared to just 17% who plan to prioritize it.
The creator side mirrors this: 29% of creators plan to use Facebook the least, versus 24% who’ll lean into it. The platform is losing mindshare on both sides of the equation simultaneously.
38. Only 28.4% of marketers prefer using Facebook for influencer campaigns
Facebook ranks well behind Instagram, TikTok and YouTube when it comes to influencer platform preference. Less than a third of marketers choose it for influencer campaigns.
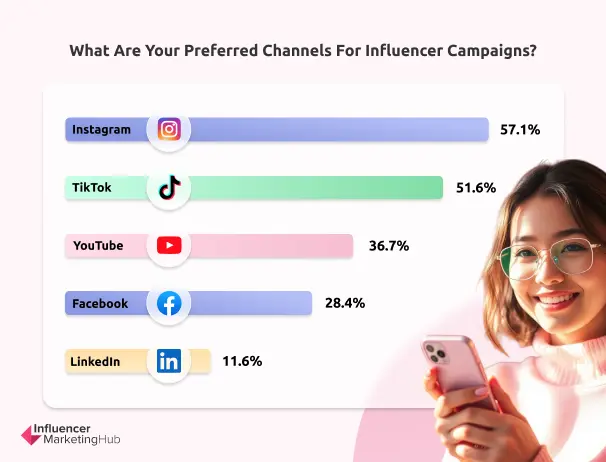
That said, the brands that do use it tend to lean on Facebook for community-driven and niche professional audiences. These are segments where Facebook Groups and longer-form content formats give it an edge other platforms can’t easily replicate.
39. Facebook generated an estimated $1.19 billion in US influencer marketing revenue from sponsored content in 2025
While platforms like YouTube and Instagram dominate influencer spending, Facebook still commands a significant share of the creator economy. The platform’s large audience and strong ad infrastructure make it especially useful for brands that want to amplify influencer content through paid campaigns, extending reach beyond the creator’s organic audience.
How do these Facebook stats inform your social media strategy?
These stats help marketers understand how big the opportunity on Facebook is, what engagement and performance realistically looks like and why it’s still worth investing in the platform for both reach and conversions.
Whether you’re running influencer campaigns, advertising products or using Messenger for customer support, understanding the latest Facebook trends and data is crucial. The platform still works, but only if your approach matches how people actually use it today.
Ready to put these insights into action? Explore these Facebook marketing tools to manage, measure and optimize your strategy.
The post 39 Facebook statistics marketers should know in 2026 appeared first on Sprout Social.
